
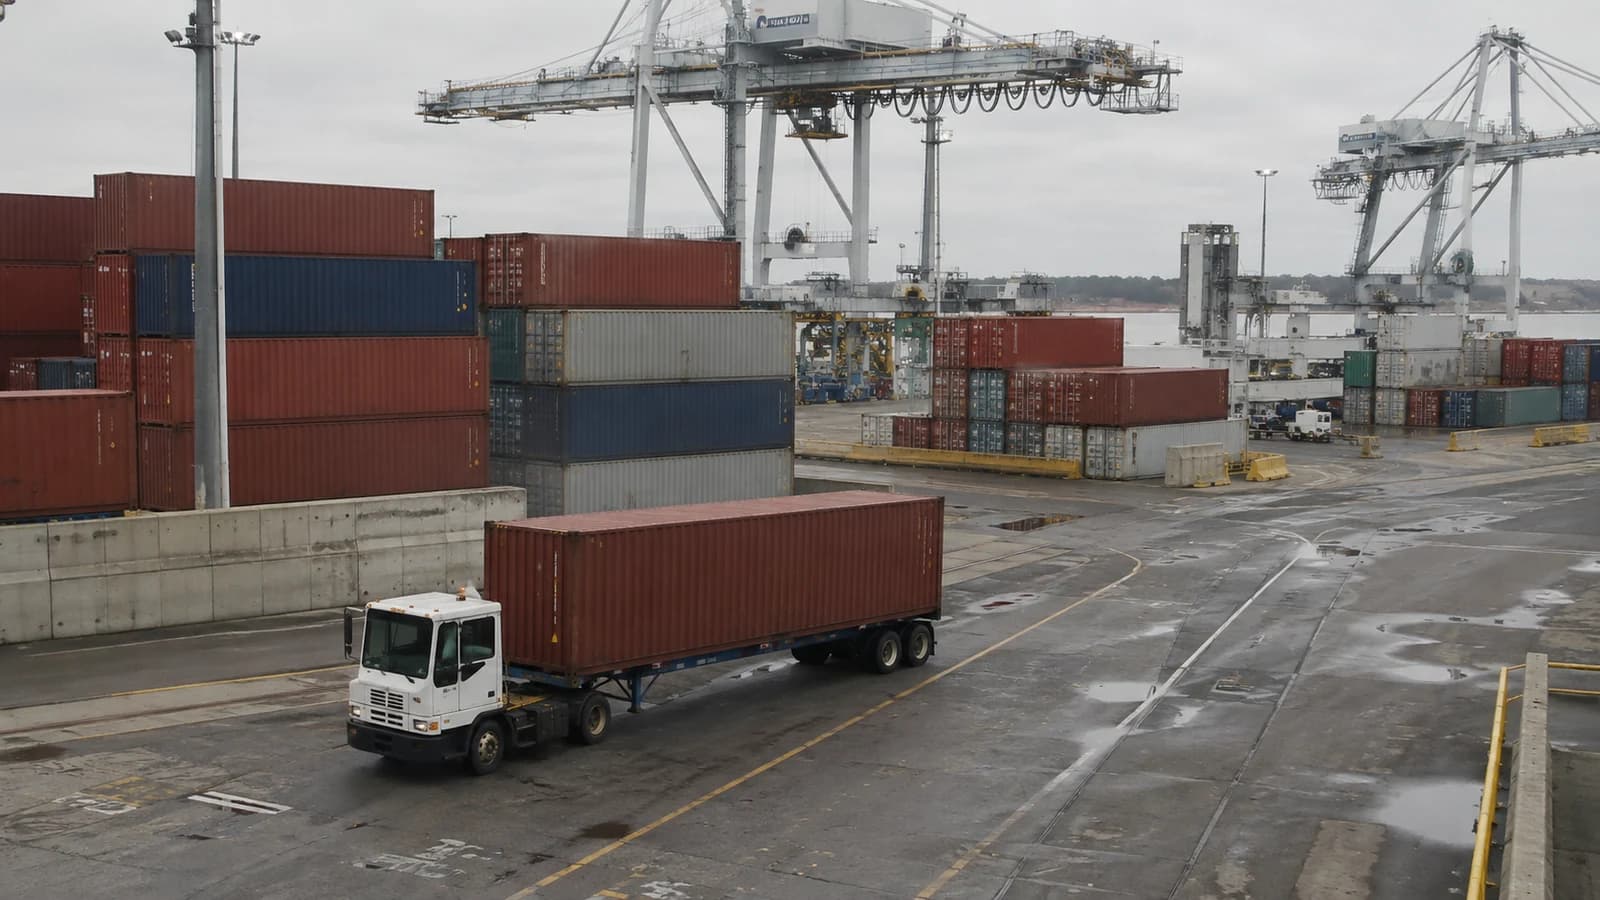
A distribution company plans its deliveries every morning. Today there are ninety orders, one warehouse, and three vans. The customer list and the order list both carry a delivery address on every row, and neither carries a stop order. The dispatcher has to decide two things: which van takes which orders, and in what sequence each van drives. Rows of addresses do not show which sequence is the cheapest.
The warehouse, the customers, and the orders exist in the data only as addresses and quantities, so route questions cannot be answered until those addresses become coordinates on a road network. Which stop comes first, how long the drive takes, what the fuel costs: none of it resolves before that. In most teams the sequencing is done by hand.
One warehouse, ninety orders, and no stop order
The company's data is already organized. The warehouse, the customers, the orders, and the vans sit as connected entities in the workspace knowledge graph. Which customer ordered how many pallets today, and how much each van can carry, is recorded there. Two things are missing: where each place is on a map, and how long the drive between any two of them takes.
- One warehouse address. Every route starts and ends there
- One customer list. Several hundred delivery addresses, with the hours each customer can accept a delivery
- One order sheet for today. Ninety rows, each with a customer, a pallet count, and a weight
- Three vans, each with a load limit, a fuel consumption per 100 km, and a shift end time
- All of this already exists as connected entities in the knowledge graph. No new data has to be collected. What is missing is the coordinates and the drive times
Without coordinates and drive times, route questions cannot be answered. In what order should van 2 drive its 31 stops? Which of today's orders cost more in fuel and driver time than the delivery is worth? Neither answer is written in any single row.
Sorted by postcode, sequenced by hand, fuel estimated from total distance
The usual method is to sort the order list by postcode, group the rows roughly by area, and give each driver a printed sequence. This works while the dispatcher who knows the city is at the desk. It becomes unreliable when that person is away, or when the mix of orders is unusual.
Cost is estimated by multiplying total kilometres by an average fuel price. Actual cost depends on drive time on a specific road at a specific hour. Congestion on the ring road at seven, a river crossing, and a one way street that forces a detour are all absent from that estimate. A route that looks 8 km shorter can use more fuel and take an hour longer.
A plan made this way is also disconnected from the data. A printed sequence does not say which order a stop corresponds to, or whether that customer accepts deliveries after two in the afternoon. If one order is cancelled at eight in the morning, the rest of the day has to be sequenced again from scratch.
Create a map and route plan from addresses
Setup isn't gathering new data; it's giving coordinates to the places already in the graph. There's no map button or sidebar icon anywhere in the app. A map only exists once the agent draws it during a chat turn.
How addresses get onto a map
Ask a spatial question in chat
"Put our stores and the last year of orders on a map." The agent reads the store, customer, and competitor entities in the knowledge graph and takes their addresses as the work to do.
A "Geocoding places" card turns addresses into coordinates
Geocoding is turning addresses into coordinates. There's one rule here: the model does not invent coordinates. Spatial computation, meaning geocoding, distance, and reachability, is all handled by deterministic services and libraries, and an address too ambiguous to resolve confidently is flagged as such rather than guessed.
An "Authored map" card appears with the map inline right below it
The agent picks the layers that fit and authors the map. Where orders cluster, a heatmap surfaces the hotspots; sales by area roll points up into districts shaded as a choropleth (regions colored by a value). The color is painted from a normalized rate, not a raw count, so that a bigger neighborhood does not always look "hotter" by sheer size.
Ask it to overlay each store's 15-minute reach
It draws the isochrone from each store, a travel time reach polygon computed on the real road network, for everywhere you can get to within 15 minutes. Overlay that reach on the order hotspots and it shows where orders pile up that fall inside none of them.
Open a full-screen tab with "View large"
The chat tucks into the left sidebar, so you keep asking while you look. The legend is full-screen only, so the choropleth ranges and layer colors lay out here.
Questions linking delivery routes to customer orders
"Order today's ninety deliveries into one route per van, starting and ending at the warehouse."
→ Three routes are drawn on the road network, with every stop numbered in drive order.
   Each route shows total distance, total drive time, and fuel cost at today's price.
   The sequence is produced by a solver, not by the model.

"Which stops cost the most to reach?"
→ The two stops that fall outside every cluster are highlighted on the map.
   Clicking one shows a "Selected: {label}" pill.
   If the mark is tied to an entity, a "View in graph" button appears with it.
   One click opens the order and the customer behind that stop.

"Order 3311 was cancelled. Re-plan the day without it."
→ The routes are recomputed and the new totals appear next to the old ones.
   Places already on the map keep their coordinates in the graph,
   so nothing has to be geocoded again.
This works because of how the computation is divided. The model decides what to draw and what to send to the solver. Deterministic services and libraries compute the coordinates, the drive time matrix, and the stop order. A route on the map is therefore not a sequence the model found plausible. It is the result of real road distances, real drive times, and each van's load limit and shift end. The route can go to the drivers with its cost attached.
The map is not a static picture. Clicking a mark adds an @mention chip to the chat composer, and the next message carries that feature's properties and coordinates with it, so there is no need to describe which stop is meant. The map answers where, and the graph answers who and what. Computed geometry such as route legs and drive time bands has no entity behind it, so those marks get no "View in graph" button.
What changes
| Before | Now |
|---|---|
| Sort the order list by postcode, group it by eye, and give each driver a printed sequence. The result depends on the dispatcher who knows the city | The agent geocodes the warehouse, customer, and order addresses already in the graph, and sends the stop order to a solver. An address it cannot resolve confidently is flagged rather than guessed |
| Estimate cost as total kilometres times an average fuel price. Congestion, river crossings, and one way detours are not counted | Drive time is taken from the real road network, and each route reports its distance, its drive time, and its fuel cost at today's price |
| A printed sequence does not say which order a stop is, or whether that customer accepts deliveries after two | Clicking a stop shows a "Selected" pill with a "View in graph" button that opens the order and the customer |
| One cancellation at eight in the morning means sequencing the rest of the day again by hand | Asking for a re-plan without that order returns new routes with their totals next to the old ones, and nothing is geocoded again |
Previously the stop order was set by whoever knew the city best, and its cost was known only at the end of the month. Now the sequence and the cost are computed on the map before the vans leave, and the dispatcher decides what goes out based on that result.
Try this workflow with your documents
Learn the steps behind this workflow, then try them with your own sources.
Open the lesson ↗